September 18, 2017
As the saying goes, "happiness is a function of reality exceeding expectations.” In other words, we are happiest when outcomes turn out better than we expect, regardless of how positive they are in absolute terms. When the bar on expectations is low, outcomes do not need to be as favorable to satisfy us as they do when expectations are high.
It turns out that this can be a useful metaphor to describe the stock market. To extend the metaphor, let reality be represented by growth in corporate earnings and cash flows. Let valuation multiples, such as the market’s price-to-earnings ratio, signify expectations. Each can be a force to drive investor “happiness,” represented by stock prices, up. Reality (earnings) can improve and push markets higher. Expectations (valuation multiples) can expand, indicating that rosy forecasts of future earnings growth are making investors willing to pay higher share prices for current levels of earnings.
With the Dow Jones Industrial Average passing 22,000 and the S&P 500 Index exceeding 2,400 for the first time in history this summer, now is a good opportunity to ask ourselves what kinds of expectations are embedded in stock prices. Valuation multiples seem to be anticipating a very bright future for the U.S. economy. When we look at a dashboard generated by Bank of America which shows stock prices relative to 20 metrics, such as earnings, sales, and GDP, 15 of those metrics are flashing above their multi-decade averages, indicating that stocks are expensive relative to corporate earnings. Investors holding equities are certainly happy. But what is the reality of today’s corporate earnings environment? And how likely is that environment to continue measuring up to or exceeding expectations?
"With the Dow Jones Industrial Average passing 22,000 and the S&P 500 Index exceeding 2,400 for the first time in history this summer, now is a good opportunity to ask ourselves what kinds of expectations are embedded in stock prices."
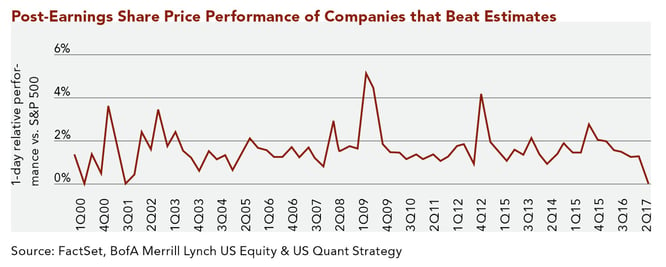
We can begin answering those questions by looking at second quarter 2017 earnings results, which delivered on Wall Street’s estimates in a way we have not seen in years. With the U.S. Dollar continuing to weaken this year while world economies strengthen, foreign sales contributed significantly during the quarter. Geopolitical tensions—investors’ top concern for 2017 according to a State Street1 survey earlier in the year—have so far failed to impede global growth. Almost 70% of the companies in the S&P 500 Index exceeded revenue estimates during the quarter, and almost 80% surpassed earnings-per-share estimates—the highest percentage of positive “surprises” since 2004. We often heard management teams boost guidance for their companies’ second half earnings results on conference calls with other analysts. Typically, companies that beat earnings estimates and raise forecasts of future results are rewarded with a bump in their stock prices. This quarter was a bit different. As we tracked our companies’ numbers, we noticed that although revenue and earnings frequently exceeded estimates, moderate declines in share prices followed. Sure enough, data compiled by Bank of America (see the chart below) showed the same phenomenon across the broader market. Among all S&P 500 Index companies that beat estimates and raised guidance this past quarter, their stock prices, on average, fell relative to the market on the day of the report. As second quarter results illustrated, high expectations require even better outcomes to lift stocks.

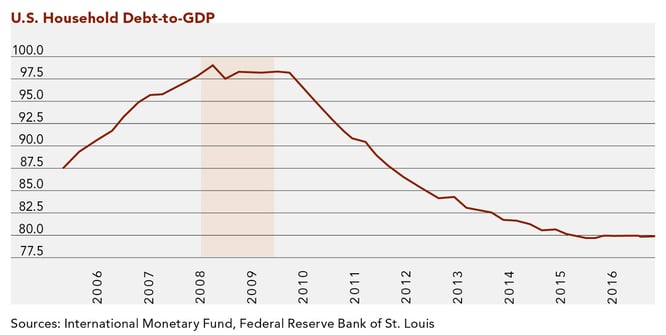
On the reality front, the “big four” domestic economic indicators—employment, retail sales, incomes, and industrial production—are grinding higher, albeit at a relatively sluggish rate since the most recent recession. The slow pace is, in part, due to household and corporate de-leveraging, as both consumers and businesses repair their balance sheets in lieu of spending on growth-generating activities like retail goods or capital investments. The benefit is that household debt-to-GDP (see the chart below) and corporate financial health measures are back to pre-recession levels. The drawback is that the high-growth snapback recovery characteristic of other post-World War II cycles is nowhere to be found.

Since the recession, U.S. real GDP has grown at a less-than-stellar 2.5% compounded rate. Although tepid growth is frustrating, it should not be surprising in context. Global economic history is littered with protracted, slow recoveries in the wake of periods marked by excessive leverage.
An investment backdrop characterized by high stock prices, high valuation multiples, and low growth can mean one of two things. One, investors may be expecting growth to accelerate in the foreseeable future. Two, investors may actually be willing to pay higher prices for slower growth prospects. With yields remaining low on government, municipal, and corporate bonds, there is evidence that the second possibility is likely. Given the choice between low-yielding fixed income securities and stocks, a continuation of the present low-growth reality becomes “rosy enough” for many investors. Simply put, unacceptably low fixed income yields mean stocks become the most attractive house on the block, regardless of how nice the neighborhood is. Although 15 of our 20 dashboard metrics point to an overvalued market, the other 5 are flashing “undervalued.” Accordingly, it makes sense that 3 of those 5 variables show that stocks are cheap only in relation to bond prices and yields.
"Given the choice between low-yielding fixed income securities and stocks, a continuation of the present low-growth reality becomes “rosy enough” for many investors."
At some point in the bull rally, implied expectations will render it very unlikely that reality will keep pace. The higher the market goes, the more likely it is to be derailed by slowing growth, rising interest rates, or a combination of the two. Until then, the trend is up. Those keeping track of financial news have probably seen the headlines from CNN, The Wall Street Journal, USA Today, and others, claiming a variation of “the bull market that began in March 2009 is getting long in the tooth,” implying that a near-term reversal is imminent. Another popular topic has been this rally’s atypically low volatility (see last quarter’s article by my colleague, Anil Kapoor), hinting that higher volatility and a corresponding market downturn are soon to come. However, the data show that, historically, bull markets rarely die of age. Moreover, periods of low-to-high volatility have come in the midst of both rallies (mid to late 1990s) and drawdowns (mid to late 2000s). Low volatility alone is not a leading indicator of market direction.
CSIC believes that investing is not about timing the broader markets. We cannot control what multiples the market assigns to underlying earnings and cash flows. What we can control—and what our Research team analyzes rigorously on your behalf—is the choice to invest in companies we believe embody the quality characteristics needed to weather economic storms and to produce earnings that are likely to grow over time. Doing so at reasonable prices can be more challenging in some markets than in others. Although there are no shortcuts to this approach, we believe it will protect and grow your capital in the long run.
1. Bartolini, Matthew. “Mid-Year 2017 Survey: Geopolitical Risk, Political Gridlock Are Top Concerns.” Blog.spdrs.com 31 May 2017.
Download Article: Market Outlook
