
August 1, 2015
Throughout the history of financial markets there has tended to be a high level of comfort
amongst investors when prices are rising steadily. Everyone is making money, retirement plans are doing well, the economy is humming, unemployment is low, and morale is generally good. Complacency sets in and most feel that nothing can go wrong. Unfortunately, it is times like these when investors should be most cautious. We often never know what might cause the next downturn until it’s already in front of us. In this market outlook, we will review the current state of equity markets and provide some color on a few cautionary flags we are monitoring in the current environment.
This past May, the broad market indices reached all-time highs. At Clifford Swan, we tend to focus on the S&P 500 Index as a proxy for the stock market. Comprised of the largest 500 companies in the United States, the S&P 500 is a commonly referenced gauge for the overall health of corporate America. In mid-May, the S&P 500 reached an all-time high of 2,130, up from the Great Recession’s low of 666 in March of 2009. That’s a total return of 220%. A six year stretch of 220% annualizes to an average annual compound return of approximately 20% per year—an astounding rise. It is evident that the U.S. Federal Reserve’s extremely generous accommodative monetary policy has helped the fragile U.S. economy rebound. Although this recovery has lagged others in terms of overall economic growth, the stock market has gained significantly given how depressed prices were.
To review, since 2009, the U.S. has averted disaster, the market has rebounded, the economy appears relatively healthy, and unemployment has been reduced to 5.3% from 10%. This is a strong list of positive variables. On the flip side, there are plenty of red flags to pay attention to—there are now more things that can go wrong rather than go right. We will discuss five of these flags:
1. Valuations are fair
If using the Price/Earnings ratio (P/E)1 as a valuation measure, the S&P 500 is currently trading at 17.5x P/E. Historically, the P/E ratio has been between approximately 11x and 20x. At 17.5x, the S&P 500 is closer to the higher end of the historic range, which means we are approaching peak historical valuations. On a Price/Book basis (P/B),2 the S&P 500 is currently trading at 2.8x. Historically, the P/B ratio has been between approximately 1.7x and 3.0x. Again, 2.8x is on the higher end of the historic range. High P/E and P/B ratios imply that it could become difficult for markets to increase more as valuations continue to expand.
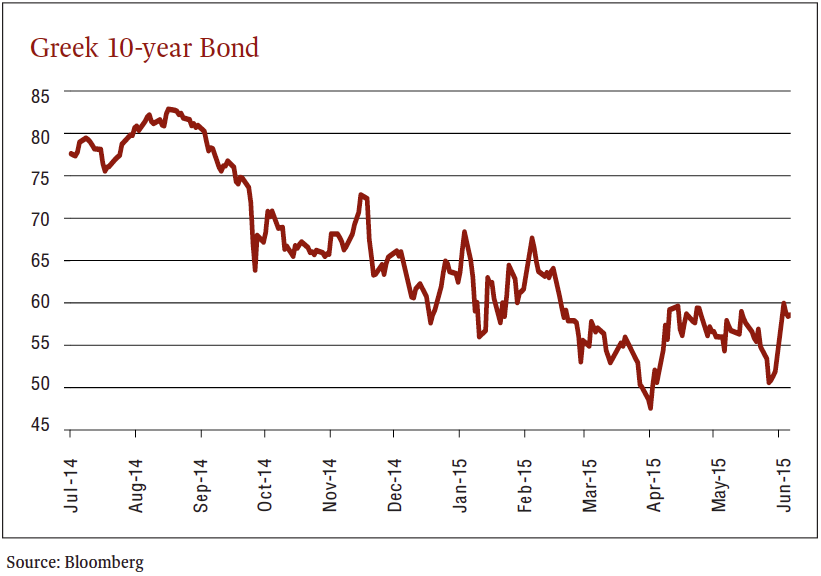
2. Greece turmoil
Greece is virtually bankrupt and there is a chance that the country could exit the Euro as its currency. This is commonly referred to as a “Grexit.” If there is a Grexit, it can set off negative reverberations around the globe. Additionally, a Grexit could provide the impetus and precedent for other European Union nations to exit the Euro. Also, decreased confidence in the Euro and the European Union could potentially stop some nations from trading with European counterparts. This would hurt some U.S. companies as they rely on revenue from Europe. Below is a chart of the Greek 10-year bond, a reflection of Greece’s credit quality, which has traded down from 82 to 58 from July 2014 through July 2015—a scary decline.
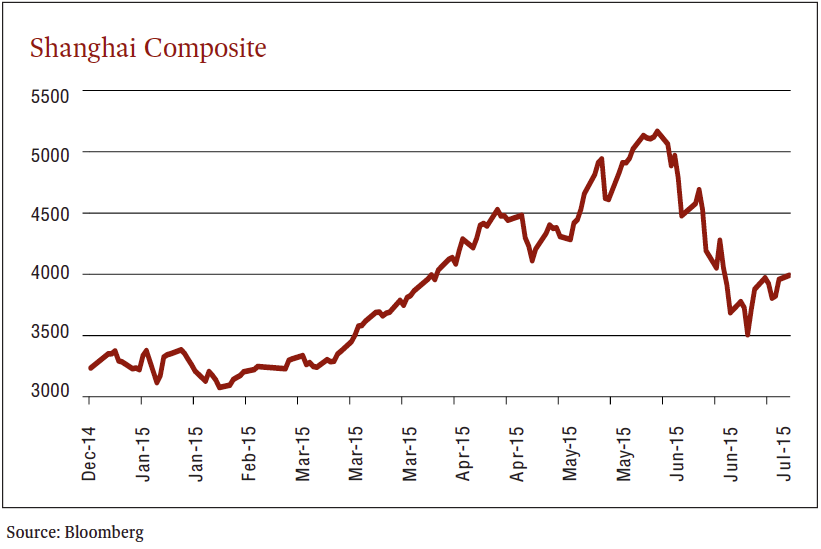
3. Chinese stocks are crashing
The Chinese stock market, as represented by the Shanghai Composite, is down almost 30% from mid-June to mid-July. With global markets more interconnected than in the past, this can present difficulties for U.S. investors. There are significant monies that were borrowed to “play” with Chinese stocks after their huge run-up. In the chart to the right, you can see the debt-fueled rise and then the crash of the Chinese stock market. Over 80% of Chinese stocks are traded by individuals or day traders. When these generally unsophisticated investors sense fear, they sell. Selling begets more selling, resulting in a crash. Given China’s huge economy, a healthy Chinese market is important for the entire world. If China suffers, the U.S. will likely suffer.
4. High-Yield Bonds are selling off
High-yield bonds are commonly referred to as “junk bonds.” Junk bonds have lower credit ratings than investment-grade corporate bonds, U.S. Treasuries and municipal bonds, and pay a higher yield because of their higher risk of default. Junk bonds are very highly correlated with stocks and are analyzed by credit investors. Credit investors tend to be much more conservative than equity investors. The reason for their conservative nature is that bonds comprise the less-risky portion of a portfolio—their role is preservation of principal. Therefore, at the mere hint of a potential loss, credit investors encourage selling. In an unnerving scenario, junk bonds have traded down over the last few months while stocks have maintained their lofty levels. Often, liquidation of high-yield bonds is a precursor to a stock sell off.
5. Spike in Mergers and Acquisitions
Heightened levels of mergers and acquisitions (M&A) is often a sign of frothy markets. The volume of M&A activity in the first half of 2015 is at the highest pace since the first half of 2007. Companies usually start to engage in increased M&A when the core business has become mature. Thus, they are forced to grow through acquisition. There seems to be a different rumor every day about companies merging. This is happening across all sectors and industries, particularly Healthcare. Stocks are rising even on the slightest rumors and, for the most part, these rumors are coming true and easy money is being made. Eventually, this rumor mongering becomes unhealthy and deals start to fall apart and confidence in markets wane.
As our clients, you are well aware that we are not in the business of making market predictions. The red flags we have reviewed could prove immaterial and stocks could very well continue their march upwards. However, the takeaway point we would like to emphasize is that as price increases, risk increases.
As a part of our research effort, we are diligently searching for secular growth in corporations which can, at times, trump broader market issues. This is a difficult concept to grasp as most investors feel emotionally secure as prices increase and nervous when prices are lower. In reality, one should feel the opposite. It’s almost like buying a pair of shoes—wouldn’t you rather buy your favorite pair on sale? Same thing with stocks; it’s best to buy on sale, and currently most stocks are full-priced.
“... we are diligently searching for secular growth in corporations which can, at times, trump broader market issues.”
Because markets are unpredictable, we at Clifford Swan structure portfolios with volatility in mind. We aim to conserve capital and make sure your financial needs are met even during potential crises. Volatility often provides opportunities to buy securities at favorable prices. It is our job to guide portfolios and take advantage of prospective market dislocations.
1 The lower the P/E ratio, the cheaper a stock is relative to its earnings. 2 The lower the P/B ratio, the cheaper a stock is relative to its net asset value.
Download Article: Market Outlook August 2015

