March 27, 2018
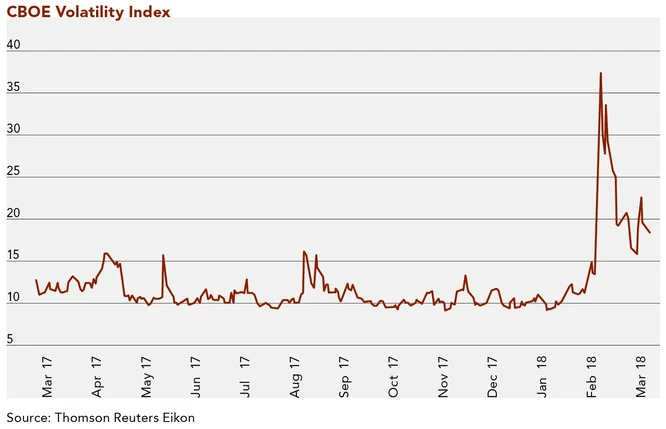
The market outlook published in the June 2017 edition of this newsletter examined the relative calmness and lack of volatility, or dispersion of returns for individual stocks, within the U.S. stock market. We used the CBOE Volatility Index (VIX) to measure volatility, which at the time was experiencing 10-year lows. This lack of volatility continued through January 2018. Finally in February, exaggerated changes in daily price movements returned with a vengeance. It is amazing how quickly and dramatically market dynamics have changed. Now, daily price ranges in the stock market are greater than entire monthly ranges were last year. Only two months into the new year, the S&P 500 Index notched 15 days in which it moved one percent or more in either direction. That’s almost twice as many such days as occurred in all of 2017. As the chart below illustrates, the recent spike in volatility has been massive.

Let’s consider the factors that may be causing the volatility that equity investors have been experiencing of late. More likely than not, the volatility can be attributed to a combination of the following dynamics, along with others we may never know.
Pulling Central Bank Liquidity
Over the last 10 years, there has been a coordinated effort amongst global central banks to inject liquidity into the system. Known as quantitative easing, this included both purchasing bonds in the open market and decreasing interest rates, and was pursued in an unprecedented fashion. Essentially, central banks flooded the system with money. These maneuvers were part of a grand plan that included gravitating investors towards stock purchases by making it less beneficial to buy bonds, which earned very low rates of interest. Some sovereign (foreign country) bonds actually had negative interest rates! In this environment, those who sought either income or capital appreciation were left with pretty much only one investment choice: stocks.
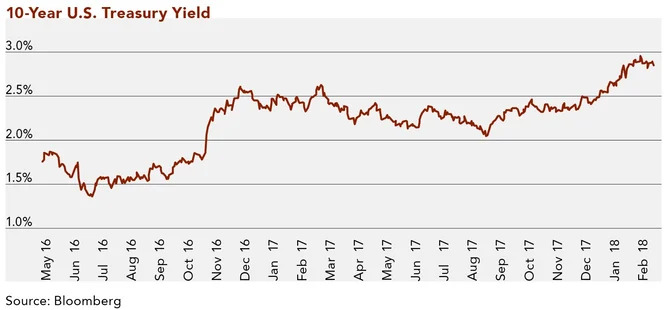
Recently, the Federal Reserve began to reverse course in the U.S. and increase rates at a rapid pace. They have also stopped purchasing bonds in the open market. The easing has now turned into tightening. Given that we have never had such low interest rates, pulling “free money” from markets could potentially have negative ramifications. As a proxy for interest rates, see the yield of the 10-year U.S. Treasury below. You will note the large increase since the beginning of the year.

There are two adverse events that can potentially occur in the stock market in an increasing interest rate environment:
- Rotation into bonds from stocks, as yields on bonds become relatively more attractive than yields on stocks compared to before.
- Higher borrowing costs could lead to less corporate spending and halt economic growth.
We think the first point is of particular concern, as many investors have been “hiding” in stocks. Stocks are not meant to be hidden in as, historically, they are a riskier asset class than the bull market we’ve experienced since March 2009 indicates.
Fear of Recession
Leading economic indicators are a “basket” of 10 guidepost financial/economic data points that often provide a warning flag for the economy. These indicators do not currently show many signs of a recession. However, we are nine years into an unabated expansion of the economy. This is the second largest expansion in history and will end eventually. One can argue we are “due” for a recession.
Inflation
The U.S. economy continues to gain momentum and unemployment is at historic lows. At this point in an economic cycle, inflation (the rate at which prices for goods and services is rising) is usually pretty high. Inflation partially results from increased wages and the consequent higher prices companies charge for products. However, this time around, inflation has been benign. Some investors fear inflation could now tick meaningfully higher given persistent strong employment data across the country. This is negative for stocks, as the Federal Reserve in their pursuit of relative price stability—will potentially engage in maneuvers to put the brakes on the economy in response to higher inflation, ultimately leading to higher bond yields and lower stock prices.
Extended Valuations
Overall, the S&P 500 Index was trading at approximately 20x Trailing Price/Earnings (P/E) when the selloff hit in early February. This is on the high end of its historic range (11x to 20x) and implies that valuations have been stretched. The higher a P/E ratio, the more expensive a stock is relative to its earnings. A mid-teen multiple would represent a more normalized level and provide room for stock valuations (and markets) to increase.
Excessive Margin
Buying on margin is borrowing funds from a broker to buy more stock than one would normally be able to, in the hopes of amplifying stock returns. On February 25, 2018, The Wall Street Journal reported that retail investors have borrowed a record $643 billion against their portfolios1. As stock values fall, brokerages conduct “margin calls,” asking investors to either sell stock or pledge additional collateral in the form of cash or securities to repay the loan. Most of the time, investors simply sell stock to satisfy margin calls. This exacerbates downward price movements during periods of market stress and volatility.
Inverse Volatility EFT Selling
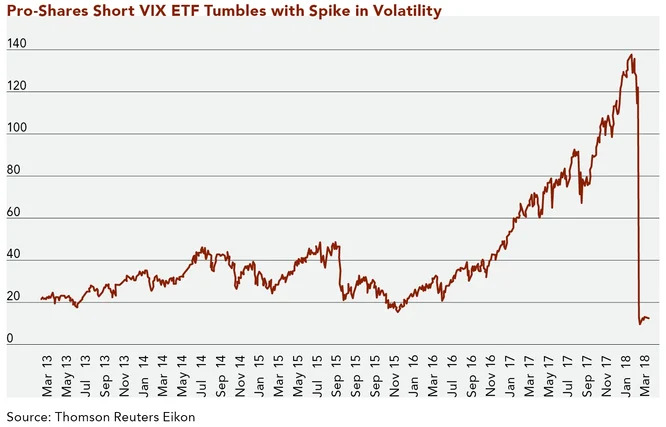
As stock markets remained calm, there were increasing amounts of monies flowing into inverse volatility exchange traded funds (ETFs). These instruments increase in value as long as volatility remains low. When volatility spiked in February, some of these ETFs collapsed almost 90% in one day. Such high levels of losses in an asset class can create panic within the broader marketplace and lead to the selling of other asset classes. To demonstrate how dramatic the selloff in inverse volatility ETFs was, below is a chart of one of these vehicles, the Pro-Shares Short VIX ETF (ticker: SVXY). Now that is scary!

While we can never pinpoint the exact reason for daily market fluctuations, hopefully this article has provided some clarity on the recent volatility. That being said, our ultimate goal is the long-term preservation of capital during market cycles, which inevitably include downturns. When this sort of volatility presents itself, we expect to take advantage of lower prices. Clifford Swan companies are some of the strongest, most stable, cash generative firms in the marketplace and we look for opportunities to invest when prices become attractive as we expect that they will perform well over time. We do not panic in these environments, but instead use our disciplined approach to identify value in the market. Combined with an appropriate asset allocation, we aim to protect capital and grow it over the long term.
1. Wursthorn, Michael and Chelsey Dulaney. “Investors’ Zeal to Buy Stocks With Debt Leaves Markets Vulnerable.” The Wall Street Journal, 25 February 2018.
Download Article: Market Outlook: Volatility Returns
