
August 14, 2019
Uncertainty works well as a theme for any stock market outlook written at any time. It always exists, as the economy, geopolitics, and many other key market drivers are inherently difficult to predict. Uncertainty seems to rise and fall constantly, though there is no formal way to quantify the sentiment.
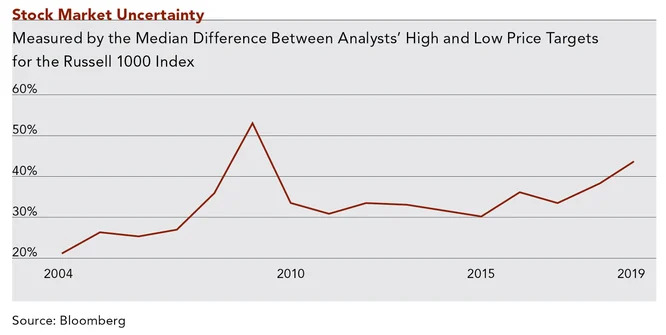
A chart published by Bloomberg in June may be a good proxy for the level of stock market uncertainty (see the chart below). The author looked at the Russell 1000 Index, which contains the largest U.S. stocks, and measured the median difference between Wall Street analysts’ high and low price targets. The gap is at the highest level in 10 years. As price targets are derived from predictions about the future, it follows that consensus about events that will drive stocks is less certain now than at any previous point in the recovery.
In an interview with CNBC in May, renowned investor Warren Buffett observed, “No economics textbook I know that was written in the first couple thousand years...discussed even the possibility that you could have this sort of situation continue and have all the variables stay more or less the same.” Buffett is referring to the dichotomy of full employment combined with persistently low inflation and interest rates. Consider a few data points: consumer confidence is at its highest level since 2000; household debt-to-GDP is the lowest since the early 2000s; and the unemployment rate is below 4% (a “generational low”). Yet, signs of a hot economy—inflation and higher interest rates—are not present. In fact, this summer, the amount of “negative yielding” debt outstanding globally reached $12.5 trillion, surpassing the previous record set in early 2016 during the energy-driven industrial slowdown. The implication is that, in the near term, investors expect a low-growth environment with central bank interest rate cuts, a condition that tends to exist when the economic backdrop looks particularly poor.
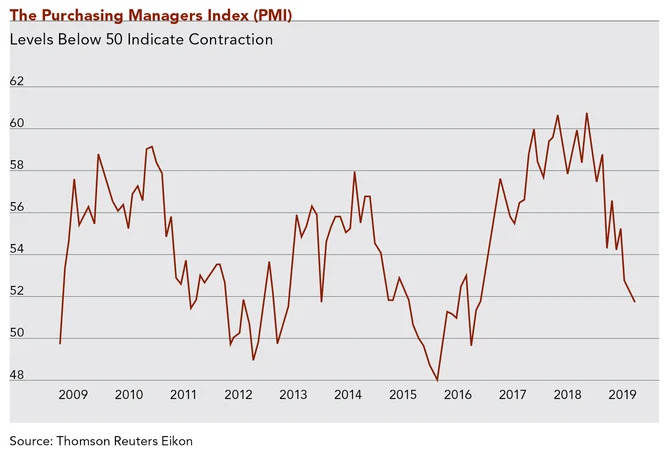
Despite a consumer financial profile that appears healthy enough to point to strong spending, there are signs that the ongoing trade dispute as well as economic softening in Europe and China are causing jitters on the supply side. Economic data points like the Purchasing Managers Index (PMI), private construction spending, and shippers’ 6–12 month freight demand outlook are at multi-year lows. These are leading indicators; the PMI, for instance, is based on surveys of data about orders, inventories, production levels, and backlogs. As the following chart shows, the PMI today is moving closer to 50, a level that represents the inflection point between contraction and expansion, after hovering close to 60 in 2017 and 2018.
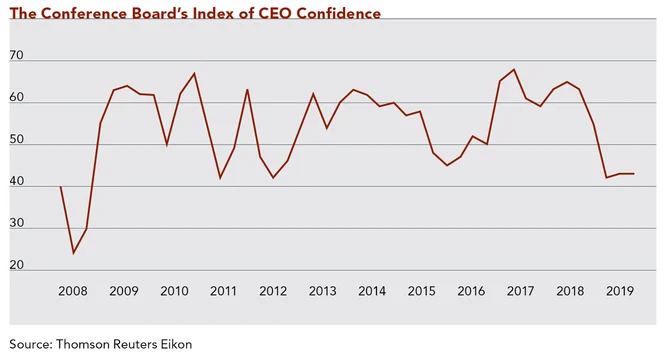
When planning for the near term, company management teams want more certainty, not less, regarding trade and demand from international customers. That is why charts such as the PMI and freight demand forecasts line up so well with the CEO confidence index (see below). And, since management teams that are confident about the direction of the economy tend to invest more in anticipation of future demand, then clearly the current economic and geopolitical uncertainty has the potential to be self-fulfilling when it comes to the duration of the current expansion.
"When planning for the near term, company management teams want more certainty, not less, regarding trade and demand from international customers."
Before giving up on the recovery that the media has been calling the “longest ever,” it is important to note that we have been here before at least twice since 2008. The PMI and CEO confidence charts in this article overlay rather nicely with each other, showing troughs in 2012 and 2016. Other leading indicators, such as the freight demand outlook and orders for durable goods, show similar troughs in 2012 and 2016—dips that turned out to be temporary.
In the face of uncertainty and conflicting market signals, there are several considerations for long-term investors like us:
1. The returns of stocks over the past several years show how difficult it is to time the market.
2012 and 2016 would have been terrible times to shift asset allocations meaningfully away from equities for the sake of trying to get out ahead of a market downturn. As of this writing in late-July, the total return of the S&P 500 is 14.4% annualized since the beginning of 2013 and 14.6% compounded since the start of 2017. No one knows whether today’s situation will be similar. The best time to make broad shifts in how much to invest in stocks is and always will be when one’s long-term goals change.
2. The economy and the stock market experience normal, cyclical fluctuations over time.
Not every correction, or even every recession, signals the death knell of a portfolio. In contrast with 10 years ago, the financial system is healthy. Banks have been passing stress tests with ease this year. To be fair, there are signs of elevated risk-taking in the current environment—examples include positive receptions for IPOs without a path to profitability and strong demand for risky debt—but excesses like those found in the housing and credit markets circa 2006 are not present.
3. Despite a high level of uncertainty, a macroeconomic backdrop characterized by low interest rates can make stocks look relatively attractive, boosting underlying demand.
Simply put, when fixed income yields are low, investors seeking reasonable returns often boost their allocation to stocks. This would be a red flag if stock valuations were particularly elevated. Buying overvalued securities for reasons unrelated to their fundamentals would not be a sign of healthy capital markets. However, with the P/E ratio of the S&P 500 just under 18x as of this writing, valuations do not appear extended.
"...we target businesses with strong balance sheets and abundant growth prospects built to be able to turn a profit notwithstanding the macroeconomic picture."
From an investment selection perspective, the current environment illustrates an advantage of Clifford Swan’s focus on quality companies. One of the pillars of our strategy is buying companies with durable business models. That is not to say that these companies’ earnings and stock prices will rise in all economic conditions. Rather, we target businesses with strong balance sheets and abundant growth prospects built to be able to turn a profit notwithstanding the macroeconomic picture. We are confident that portfolios constructed this way will achieve higher highs and higher lows over long periods, making the market downside case only relevant in the short term.
Download Article: Market Outlook
The above information is for educational purposes and should not be considered a recommendation or investment advice. Investing in securities can result in loss of capital. Past performance is no guarantee of future performance.

