May 18, 2016
The last market outlook I wrote for this publication was in July 2015. At that time, the S&P 500 Index, which serves as a broad stock market proxy, was trading at approximately 2,100 and approaching all-time highs. The main takeaway of the July 2015 market outlook was that the potential risks within equities outweighed the potential rewards. We discussed many market warning signals and thought this foretold either a price drop or a waning market after the more than six-year-old bull market run that began after the Great Recession of 2008/2009.
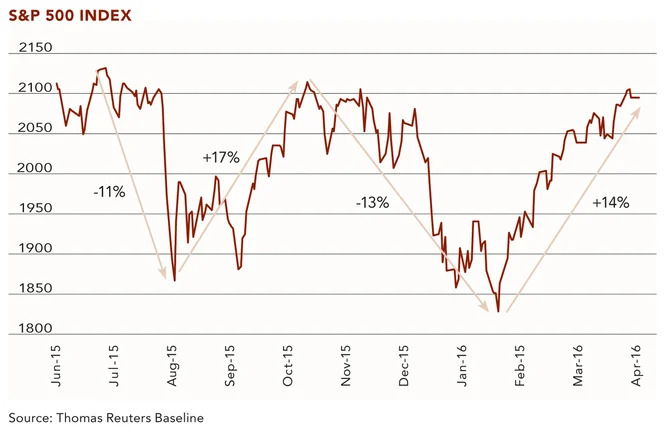
Time proved that we were correct in our assessment of the state of the market. Immediately after the publication of our July market outlook, the S&P 500 Index sold off 11% from its highs. Subsequent to that, we saw a 17% rebound back to the highs, then another 13% selloff, followed by a 14% gain. We have observed two complete roundtrips in a matter of nine months! The chart below summarizes the story nicely—as you can see, volatility has been quite staggering of late.

The natural question is why are these gyrations occurring? Let’s consider a few possible reasons.
Federal Reserve Posturing
Over the past year, there has been much debate amongst investors as to whether the Federal Reserve should continue increasing interest rates. There were hints made by officials in mid-2015 that steady increases were on the horizon. Then earlier this year, the Federal Reserve reversed their previous indications and decided to not raise rates any further for the time being. This constant back-andforth posturing by the Federal Reserve is confusing investors. It is having an even more significant effect on dividend-paying stocks as these securities are more sensitive to moves in interest rates given the dividend income stream. Dividend-paying stocks are often used as substitutes for bonds, which means that their prices can fluctuate as interest rate forecasts ebb and flow.
Energy
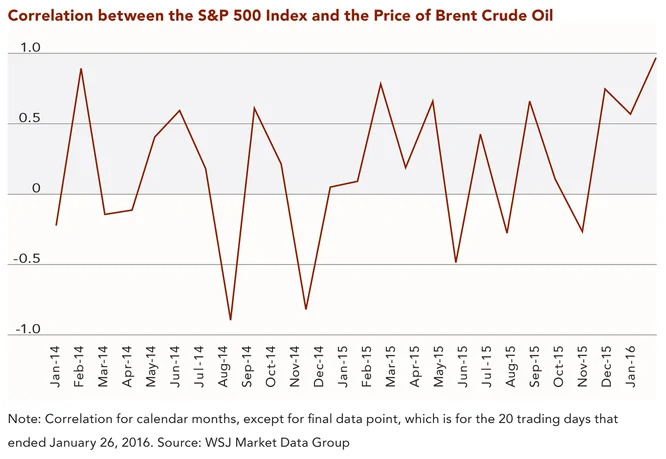
The price of oil is down from $105 per barrel two years ago to $43 per barrel as of this writing. In between these two prices, there have been many ups and downs. Recently, as these extreme price movements have taken hold, the entire stock market has been taking its cue from the price of oil. The very nature of commodities is that they are driven by supply and demand and thus can exhibit huge price swings. The fact that the market is hanging on every move in the price of oil to the current degree exhibited is bizarre. According to an article published on January 25, 2016 in The Wall Street Journal,1 the correlation between the S&P 500 Index and the price of Brent crude oil has not been this high in 26 years. To review, correlation measures how two variables (in this example, the S&P 500 Index and the price of Brent crude oil) move in relation to each other, with the continuum ranging from -1.0 to +1.0. A correlation of -1.0 indicates that the two variables are perfectly negatively correlated and move in opposite directions, while a correlation of zero shows that the movement of one variable is not connected in any way to the movement of the other. Finally, a correlation of +1.0 means that the two variables are perfectly positively correlated and move in lockstep with one another. Over 20 trading days in January, the correlation reached 0.97 (see the chart below), higher than any calendar month since 1990.

Valuations
The ratings and target prices of the stocks on our proprietary Clifford Swan stock selection list serve as a good barometer for the valuation of U.S. equities. Under our system, higher stock ratings and target prices represent a “buy,” which indicates that a stock’s market price is at a substantial discount to the intrinsic value our internal analysis assigns to that stock. At the extreme highs in the S&P 500 Index chart above, there were fewer buy-rated stocks on our list, while at the nadirs there were more buy-rated stocks. Thus, the valuations at the bottom of the market get attractive and investors step up to participate in market rallies. At the top, investor selling contributes to price declines.
High Short Interest
Short interest represents the amount of shares that are sold short in a company. When investors sell shares short, they benefit from and are hoping for shares to go down in price rather than up. High short interest indicates a lack of confidence in either a company or market fundamentals. As the global economy struggled throughout 2015, short interest crept up across several economically sensitive industries. High short interest exacerbates price movements as it creates additional trading volume and buying pressure when short positions are closed.
Trend Followers
Over the past ten years, trend following has garnered a lot of attention as a trading strategy. Trend following has many fancy names such as “managed futures” but in the end it is simply momentum-based trend following. Momentum refers to buying or selling according to what has been happening in the market. Therefore, if prices are going up the investor buys more, and if prices are falling the investor sells the stock short. This sort of trading strategy leads to rallies and downturns being sharper as investors simply keep piling on quickly as they follow the trend. Once a trend reverses, the price action moves quickly the other way.
High-Yield Bonds
High-yield bonds, also known as “junk” bonds, represent bonds issued by lower quality companies. These bonds carry higher interest rates commensurate with their risk. The high-yield market has been unstable over the past year as many of the issuers in the market are comprised of struggling energy companies. As bankruptcy rumors swirl, high-yield investors get nervous and bond issuances can dry up. A jittery high-yield market can also unnerve stock investors as risky companies approach bankruptcy; if a company fails, they are obligated to satisfy their debt obligations before paying equity investors. Additionally, as these risky companies lose access to the capital markets and can no longer issue debt, their stock prices suffer. There is currently a great deal of instability within the high-yield bond market, which has carried over into stocks.
It is our hope that the factors discussed above provide a helpful background and rationale behind the recent instability in the market. As we have mentioned many times in the past, we at Clifford Swan Investment Counselors embrace erratic markets like the one we have been currently experiencing. The knowledge base we have acquired over our 100 years of existence is substantive enough that price dislocations do not bother us. Rather, when we combine our experience and appreciation for the relationship between price and value, these sorts of markets provide us with many opportunities.
Looking forward, we expect these choppy markets to continue for the near-term, with a bias towards the downside. Over the longer-term, we believe equities will remain an attractive asset class. With this in mind, we will adhere to asset allocation guidelines and prudently invest within our universe of higher-quality bonds and stocks.
1 Stubbington, Tommy, and Georgi Kantchev. “Oil, Stocks at Tightest Correlation in 26 Years.” The Wall Street Journal 25 Jan. 2016.
Download Article: Market Outlook: A Roundtrip Journey
